
Mail Designer 365 Campaigns includes powerful analytics and insights so you can see how your emails are performing with your subscribers. Understanding these metrics allows you to improve your campaigns, make data-driven decisions, and ultimately achieve better engagement and results.
Jump to Section:
- Why Are Email Analytics Important?
- Accessing Email Analytics
- Understanding and Interpreting Email Analytics
- Quick Tips for Interpreting Your Email Analytics
Why Are Email Analytics Important?
Email analytics give you a clear picture of how your campaigns are received. By monitoring metrics like open rates, clicks, and unsubscribes, you can:
- Measure engagement: See which emails resonate most with your audience.
- Optimize content: Identify what subject lines, designs, and offers perform best.
- Improve deliverability: Spot issues with email bounces or spam complaints.
- Refine strategy: Make smarter decisions for future campaigns based on real data.
In short, email analytics are the key to sending smarter campaigns that connect with your audience.
Accessing Email Analytics in Mail Designer 365
To view your sent campaigns, go to Mail Designer 365 Delivery Hub > Completed campaigns:
Next, click the statistics icon next to any campaign to open your personalized Campaign Report:
![]()
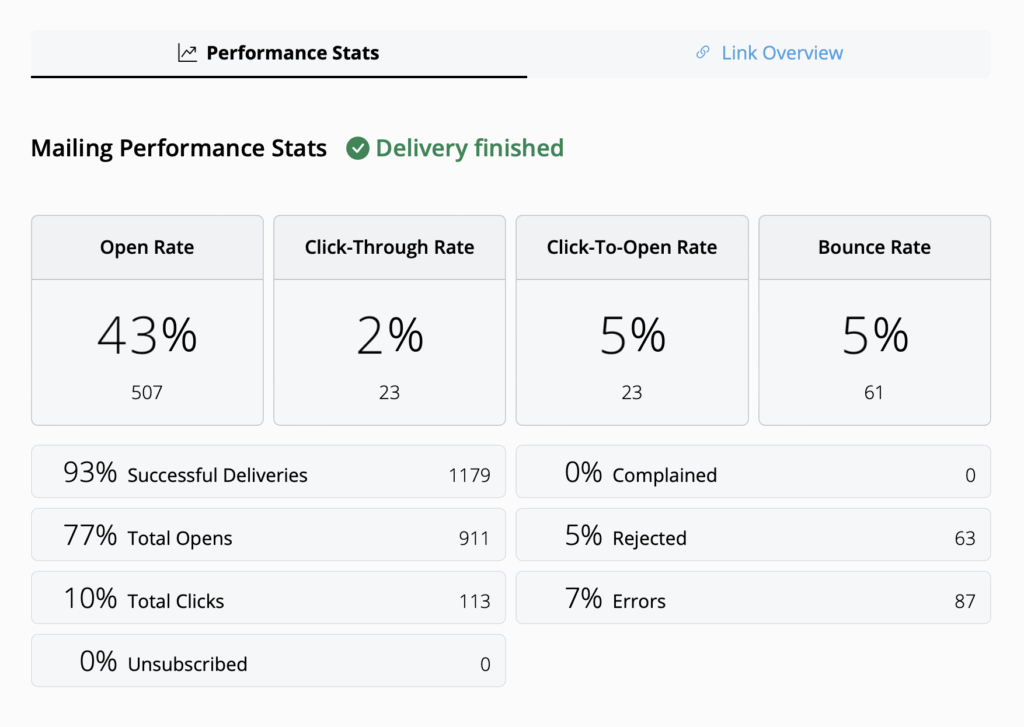
You’ll now see a breakdown of all essential email analytics, including the number of recipients, open rate, and link clicks:
Understanding and Interpreting Email Analytics
The performance report covers a wide range of metrics designed to help you understand how your campaign performed and identify areas for improvement. Here are the most important ones:
- Open Rate: Percentage of recipients who opened your email. Industry benchmarks vary, but anything above 25% is typically considered strong.
- Click-Through Rate (CTR): Percentage of recipients who clicked on links in your email. Average CTR across industries is around 2–3%.
- Click-To-Open Rate (CTOR): Percentage of recipients who clicked on links out of those who opened the email. This metric helps you gauge content effectiveness; aim for around 10%.
- Bounce Rate: Percentage of emails that were not successfully delivered. Keep this as low as possible — above 3–5% may indicate a problem with your email list.
- Unsubscribe Rate: Percentage of recipients who opted out after receiving your email. Ideally, keep this below 0.5%. If the rate is higher, review your content, email frequency, and audience segmentation.
Other Useful Statistics
- Complained Rate: Percentage of recipients who marked your email as spam. If this occurs, review your content and follow best practices to avoid spam filters. Learn more →
- Rejected Rate: Percentage of emails rejected by email providers (Gmail, Outlook, Yahoo, etc.). High rates may indicate issues with your sending domain. Make sure you’re sending from a verified email address. Set up DKIM →
Quick Tips for Interpreting Your Email Analytics
- Track your Open Rate to evaluate your subject line effectiveness.
- Use CTR and CTOR to see how engaging your content and links are.
- Keep an eye on Bounce Rate to maintain a healthy email list.
- Monitor Unsubscribe Rate to adjust frequency or content if needed.
- Investigate Complaints or Rejected Rates promptly to protect your sender reputation.
By regularly reviewing these metrics, you can continuously optimize your campaigns and send smarter, more effective emails.
How Can We Help?