
Project status reports are a super productive way to help you and your team keep track of an ongoing project or business venture. Although they are usually built using Excel or similar programmes, you can actually build a detailed project status report right inside an email.
Sounds complicated? It's definitely not! Here are our top tips on how you can use Mail Designer 365 to build a visually effective report which you can integrate into your email...
What to include in your report
The exact contents of your project status report will vary depending on what your project is and who is involved. In order for your report to be as effective as possible, you need to consider what it is that you want to communicate to the rest of your team. Here are some of the most important criteria associated with any project:
- Financial status: Are you inside your planned budget? What is the total cost so far?
- Progress made since the last report: Which actions have been taken? How does this compare to planned progress?
- Risk assessment: Are there any new risks? How could they delay completion?
- Outstanding tasks: What is yet to be completed? Will this delay completion of the project?
- Timeline: What is the expected completion date? How does this differ to the planned completion date?
How to present your report
There are a number of popular ways of effectively presenting a project status report. Here are some key factors to include:
Color
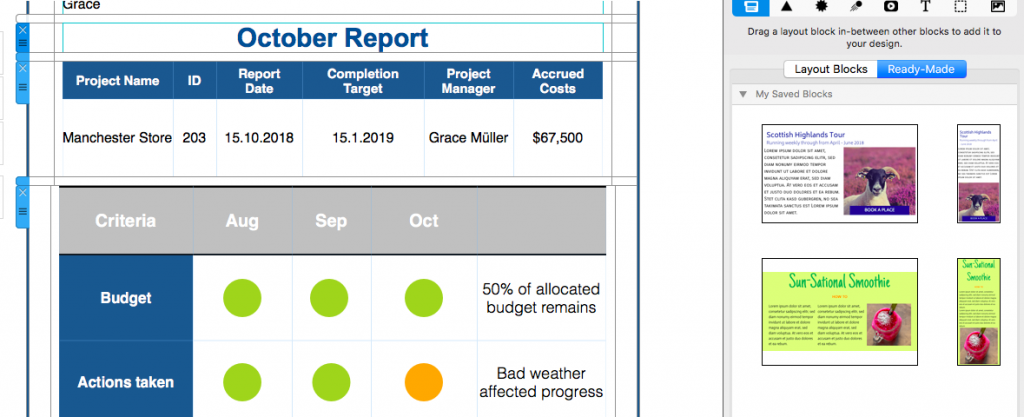
Using color is a great way to make the information in your table more visually effective.You can use whatever color scheme you like to brighten up your report, but one popular choice is the traffic light system. Use green for the positive aspects of your project (e.g. what is going well), amber for the aspects which need improvement, and red for the things which need to be addressed urgently (e.g. risk factors.) Here is an example of a project status report using the traffic light system.
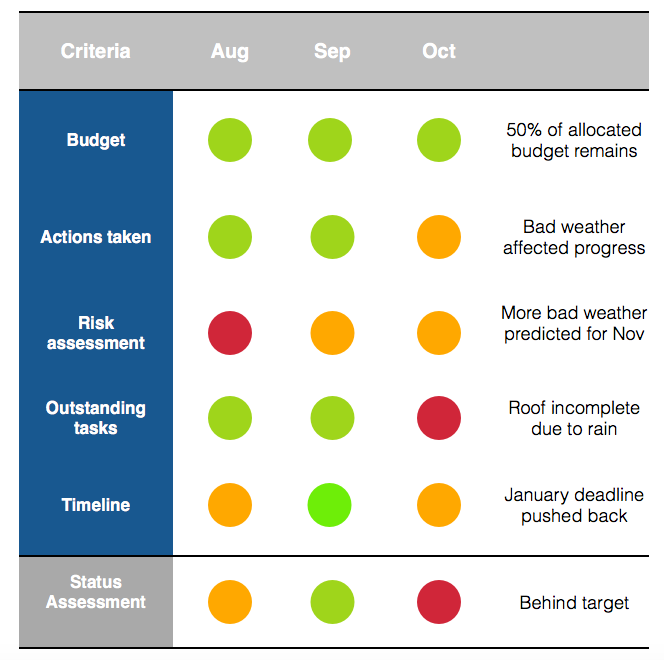
An example report using the traffic light system
Scope of the report
Depending on the length of your project, you may have to present the information in your report differently. Reports can be sent out weekly, monthly, quarterly, or, in some cases, as a one off. If possible, it is good to include some way of comparing progress with previous reports. You can do this by including a simple summary of the previous reports (e.g. the previous 3 months.)
Key information
As well as the evaluation criteria for your report, a well-presented report should also contain the key information about the project. Particularly in bigger businesses where multiple projects may be happening at once, it is useful to label the report correctly to avoid confusion for yourself and other team members. Most importantly you should include:
- Project name and ID code (if applicable)
- Date of report
- Name of project manager
- Target completion date
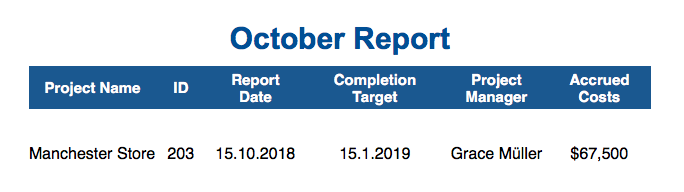
Example of key information for a project report
You can also include the following information if you feel it is relevant:
- Project department
- Project phase
- Project budget
- Priority level
- Project sponsor
- Costs so far
- Start date of project
How to build your report in Mail Designer 365
Step One: Set up a table in Mail Designer 365
In Mail Designer 365, project status reports can be quickly built up using the tables feature. Go to "Contents" > "Layout Blocks" and scroll down to the bottom to find the table blocks. You can then drag and drop a block into your email design.
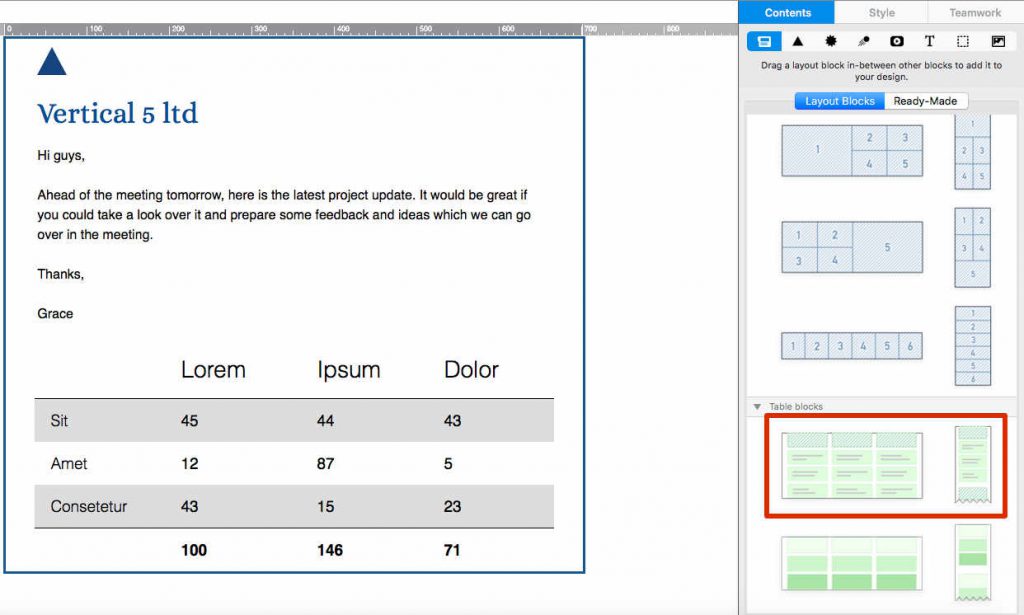
Drag and drop a table block into your design to get started
Step Two: Fill in your evaluation criteria
Double click on a table cell to edit text. You can insert as many components as you like depending on your needs. To adjust the amount of rows and columns, click on the table. This will open the style menu. Click on "Structure" and use the formatting tools to build up your table.
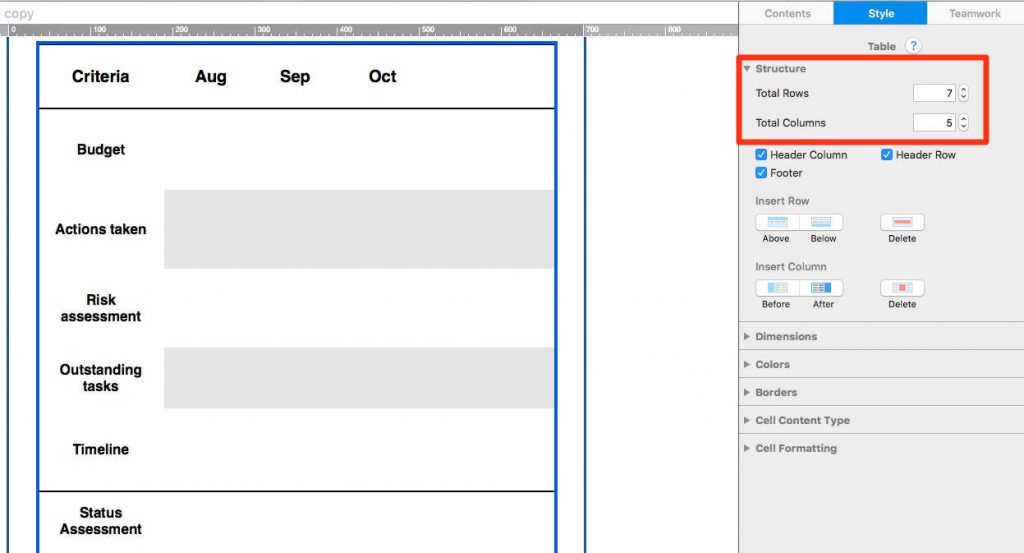
Add rows and columns for your evaluation criteria
Step Three: Add some color
We talked about the importance of using color in your report. Customize the color layout of your table by clicking on a cell and opening the "Color" section in the "Style" menu. Here you can change the color of one cell, or an entire column or row.
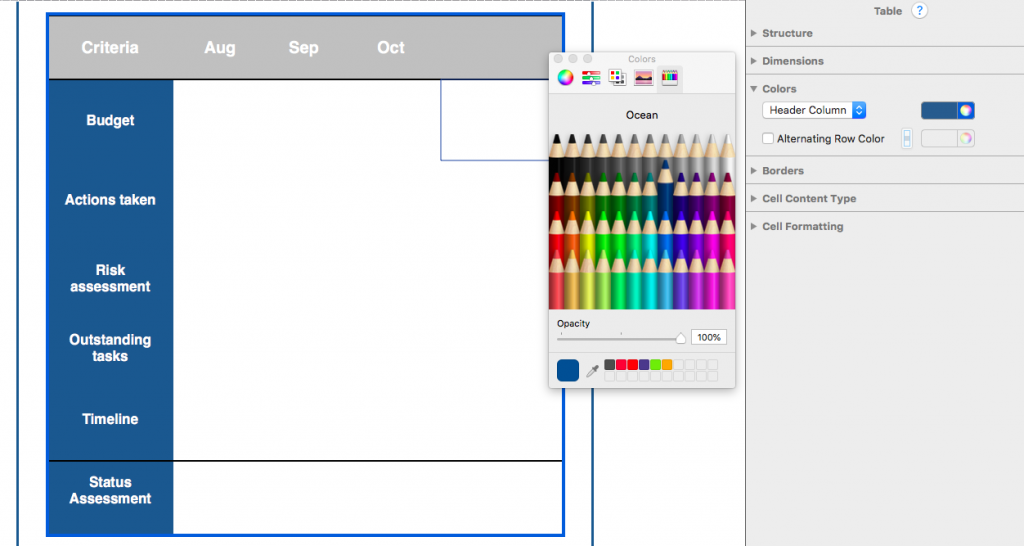
Adjust color settings to make your table more visually effective
There are several ways you can incorporate the traffic light system. We suggest using shapes, as this is visually effective and easy to copy and paste. In this example, we are using circles:
- Set the cell content to image block. You can do this in the "Cell Content Type" section.
- Head to the "Contents" tab in the sidebar, find "Shapes" and drag a shape into the cell.
- Click on the shape to change the color according to the traffic light system.
- Copy and paste the shape until you have filled up all of the criteria.
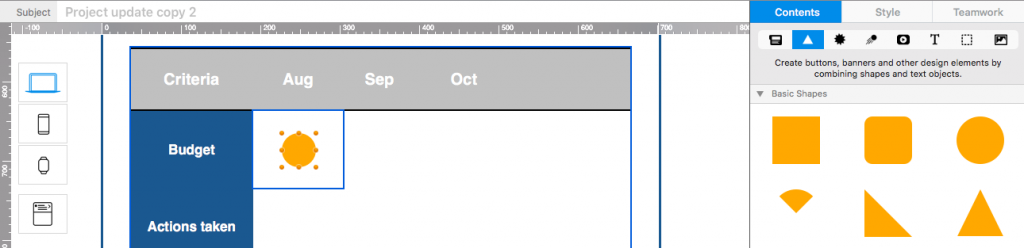
Use shapes to recreate the traffic light style
Step Four: Add information
The traffic light system is useful, but it is much better to have some written information included in the table to give your team some context. In the last column, you can write down your notes as to why each section has been graded red/amber/green. Make sure to change the cell content type for this column to text:
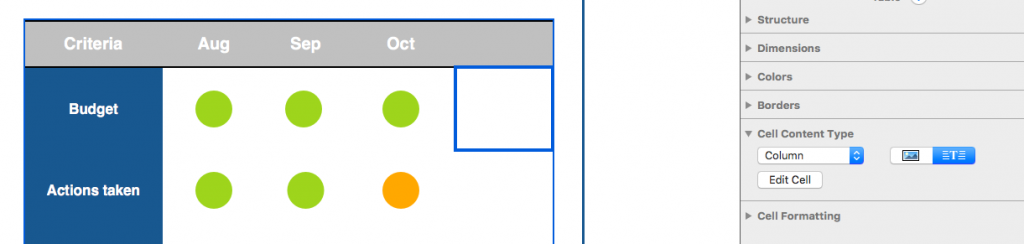
In the final column you can include written notes for your team
It's up to you how you present the key information about the project. We simply inserted another mini table above the main report with 2 rows and enough columns for the key information. This clearly labels the project report and gives your colleagues some context before they start reading.
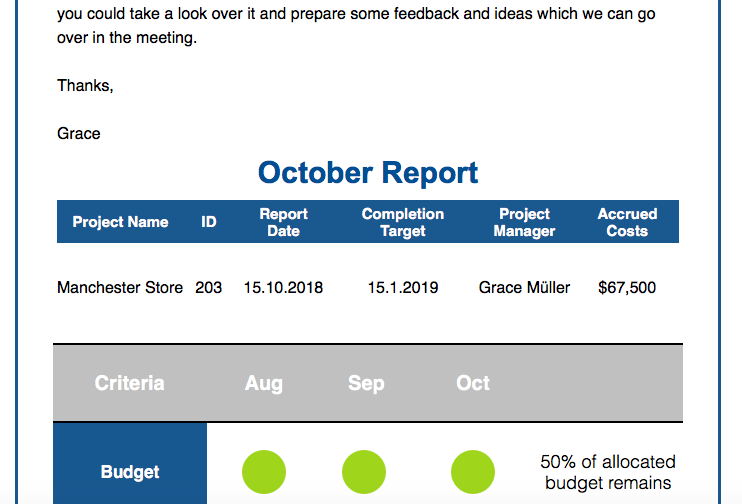
For context, add a table with your key information above the report
Extra Tip: Save your table layout
Although setting up a table in Mail Designer 365 is super straightforward, it's not actually something you have to do each time you want to send a report out to your team. You can save your table layout so that all you have to do next time is edit the cell contents. To do this, go to the "Layout blocks" menu again, open the "Ready-Made" tab, then hold down the "cmd" key and click on the layout handle of your table(s) and drag it into the sidebar to save.
Save your table blocks in the ready-made blocks section for next time
Reports made easy with Mail Designer 365
Take the hassle out of building and sharing project status reports and do everything in one app. With Mail Designer 365 you can build brilliant HTML emails using drag and drop and create a report to rival Excel. Use the tables feature to build up a professional report which is fully integrated into your email and then send directly via the app from your own email address. No attachments, no fuss, just one app.
Give Mail Designer 365 a try today for free...